Log_Analysis
Udacity/Full_Stack _Web _Developer/Project-3 _ Log_Analysis
This project is maintained by vjvijayg
Udacity Log_Analysis
Udacity log analysis project is to build an internal reporting tool that will analyze information from the newspaper database to discover what kind of articles the site’s readers like. Source code can be found here
Installation and Setup:
- Install Vagrant and Virtual Box
- Download fullstack_nanodegree_repo zip or clone here
- Download News Database or clone here and move these files to Vagrant directory, which can be found in fullstack_nanodegree_repo.
Implementation:
- Navigate to full-stack-nanodegree-vm/vagrant directory through the command prompt or terminal.
- Execute
vagrant upcommand - Execute
vagrant sshcommand to login the Virtual Machine you may need login details - Change the directory after successful
vagrant sshexecute cd /vagrant - To load and run the News Database use
psql -d news -f newsdata.sql. - Create views listed below
- After successful creation of Views Run
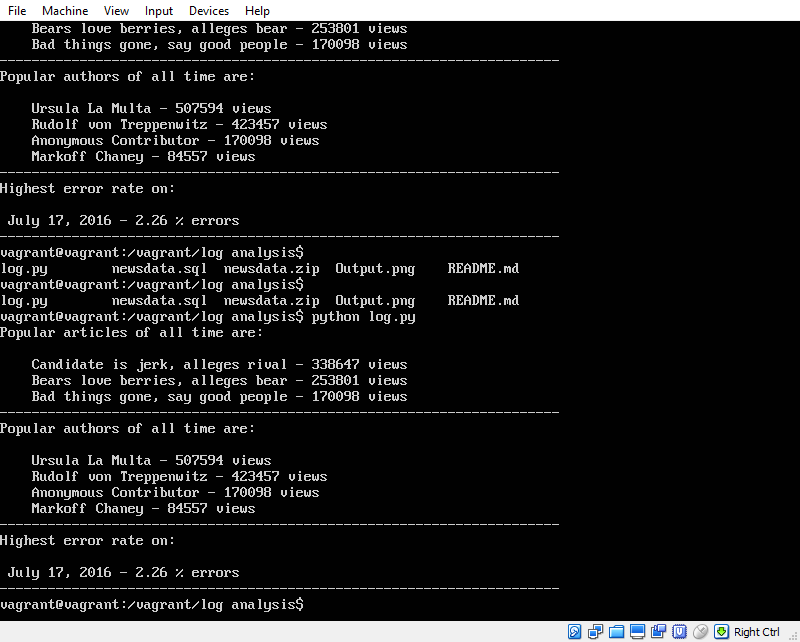
python log.pyto check out the output.
Views created to solve tasks:
- What are the most popular three articles of all time?
create view new_log as select substring(path, 10) as newpath, status, id from log; - Who are the most popular article authors of all time?
create view art_log as select new_log.newpath, articles.author,articles.slug, articles.id from new_log join articles on articles.slug=new_log.newpath; - On which days did more than 1% of requests lead to errors?
 create view error_log as
 select time::timestamp::date as date, count(*) as errors
 from log where status similar to '404%'
 group by date order by errors desc;
create view request_log as select time::timestamp::date as date, count(*) as requests from log group by date order by requests desc;create view error_rate as select error_log.date as day, error_log.errors::float/request_log.requests*100 as error_ratio from error_log join request_log on error_log.date=request_log.date order by error_ratio desc limit 10;
Software and tools used:
Skills gained:
- Sql (Postgresql)
- Python programming
Please refer to the wiki to find more about project.
Welcome to the Log_Analysis project, which is the part of the Full Stack Web Developer Nanodegree course
About Project
Creating a internal tool which generates meaningful reports for the Newspaper Database, which has Articles, Authors and log table using postgresql and python script. The database contains newspaper articles, as well as the web server log for the site. The log has a database row for each time a reader loaded a web page.
Tasks
Analyzing data from the logs of a web service to answer questions such as
- What are the most popular three articles of all time?
- Who are the most popular article authors of all time?
- On which days did more than 1% of requests lead to errors? using advanced SQL queries.
Output of the report
Building an informative summary from logs is a real task that comes up very often in software engineering.
Software and tools used:
- Vagrant
- Virtual Box
- Git bash
Skills gained:
- Sql
- Python Script